Blue Hexagon | FractalScan Logo

Detailed Data

Gain unprecedented access to the underlying scan data
Two Blue Hexagon | FractalScan Logo

Explore the data in detail

For many the understanding of risk is enough, but those more technically adept may want to explore the issues further.

In many tools you are limited to the data presented to you, often confined to a pre-built dashboard view. FractalScan Surface is different.

Create a free account

Deep dive into your data

FractalScan Surface allows you to deep dive into the data and truly identify where the issues are present within your infrastructure, what is causing them, and the other areas within your systems that are affected.

Book a demo and get a true understanding of the detailed data of your attack surface with FractalScan Surface.

Book a demo

Provenance view

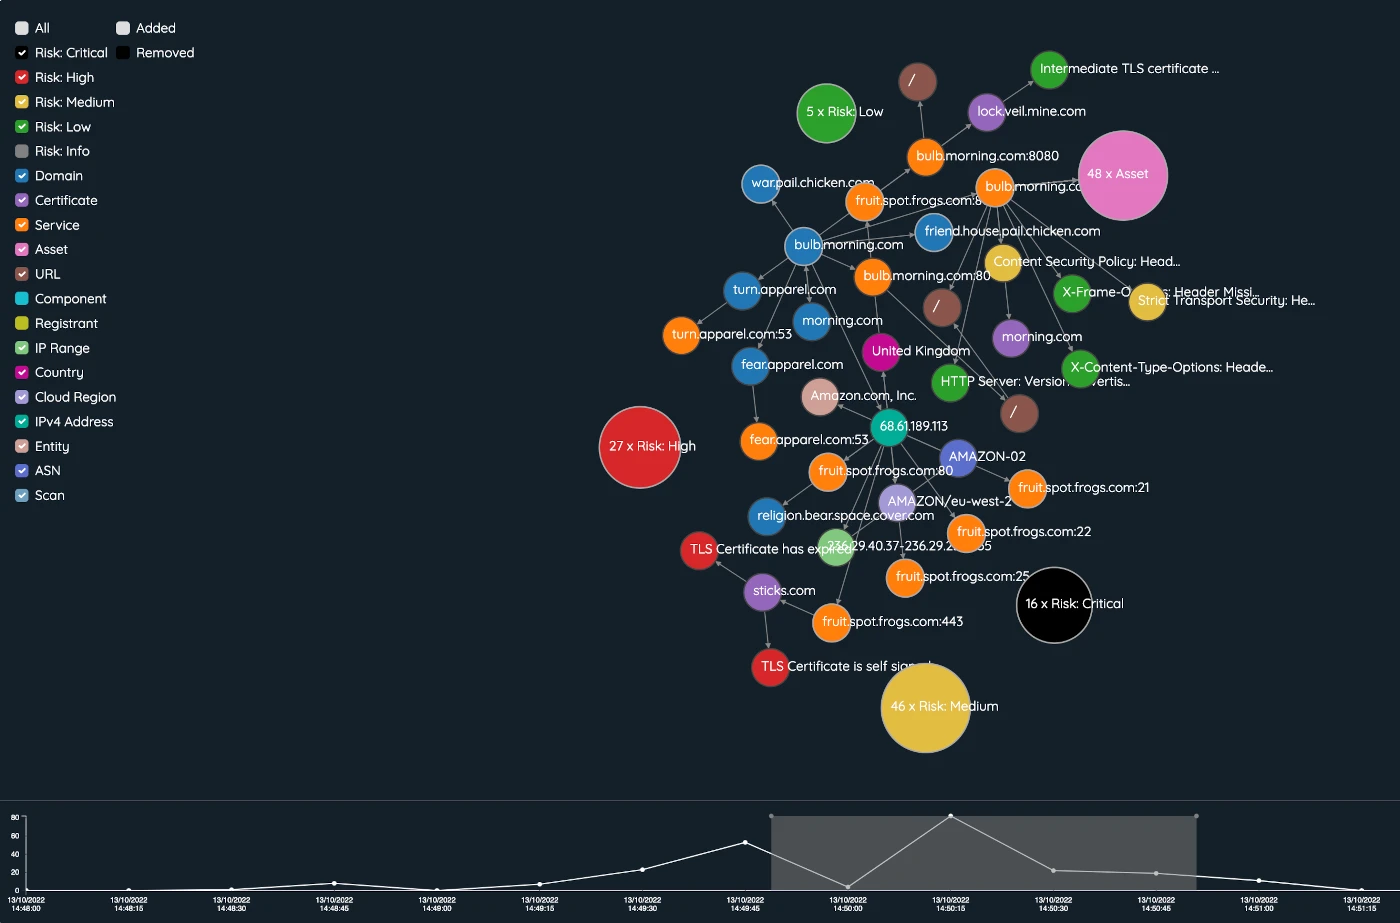
Your data is presented in both text and graph formats, giving you the flexibility to use the data in a format best suited to you. The provenance view allows you to visualise how your infrastructure is connected and trace risks back to where they stem from.

Pages path risk on FractalScan dashboard
Multi components graph FractalScan dashboard

Graph view

Through the graph view you can use filters to target specific data points based on a wide variety of parameters. The date range function allows you to see the changes over time and even isolate a specific timeframe.

Create a free account

Understand and remediate

Understand exactly how the different parts of your infrastructure interact with one another and identify the areas you can work on that will make dramatic improvements to your cyber security posture.

Book a demo

REVIEWS

What our customers think